A Shopper Spent 12 Minutes in One Aisle. What Does That Actually Tell You?


A research-backed guide to retail dwell time, what the number can — and cannot — tell you, and how existing CCTV can turn zone-level behaviour into operational insight.
A Shopper Spent 12 Minutes in One Aisle. What Does That Actually Tell You?
A shopper walks into a product aisle and stays there for 12 minutes. At first, that sounds like a useful number. But the number alone does not tell you whether the shopper was comparing products, studying a high-value item, confused by the choices, waiting for assistance, or simply slowed by a crowded aisle.
The 12 minutes are real. The interpretation is not automatic. That is the difference between measuring retail dwell time and actually using it to understand what is happening inside a store.
What is retail dwell time?
Retail dwell time is the amount of time a shopper spends in a store or within a defined area of that store. At store level, it can describe visit duration. At zone level, it becomes more operational: a retailer can compare how long shoppers spend near a promotion, in a high-value section, around a display, in a fitting-room area, or in an aisle that receives little attention.
Research shows why a single benchmark is risky. A large 2017 study covering 654,000 transactions across supermarkets, hypermarkets, convenience and specialty stores in the United States, United Kingdom, China and Australia found substantial variation in trip length, store coverage and basket behaviour across shopping trips. The findings support a simple point: shopper behaviour is heterogeneous, so dwell time should be interpreted in context rather than treated as a universal score.
Twelve minutes can mean very different things

A high-value product section
A shopper spending 12 minutes around jewellery, electronics or another considered-purchase category may be showing genuine interest. They could be comparing options, reading product details or thinking through a higher-value decision. The same duration means something different from a shopper who passes through the zone in 20 seconds.
A promotional display
If shoppers consistently stop near a display after it changes, dwell time may indicate that the promotion is attracting attention. But attention is not the same as sales. The useful comparison is whether dwell patterns changed alongside footfall, transactions or another business outcome that the retailer actually cares about.
A low-performing aisle
Long dwell may indicate engagement, but it can also signal friction. A confusing layout, hard-to-find products or unclear information can make shoppers stay longer for the wrong reason. Dwell time can identify a zone worth investigating; it cannot explain the cause on its own.
A service area
If a shopper remains in a service zone for a long period, part of that dwell may actually be waiting time. That changes the operational question from “How long did they stay?” to “Were they browsing, or were they waiting for help?” This is where dwell analytics can lead naturally into a dedicated customer-assistance workflow.
Dwell time is not queue time
These retail metrics are related, but they answer different questions. Dwell time asks how long someone remained in a zone. Queue monitoring asks how many people are waiting in a defined queue and how long that queue persists. Customer assistance monitoring asks how long a shopper has been waiting in a configured area without staff nearby.
FlowLinks treats them as separate use cases. Its Dwell Time Analytics measures time spent in defined store zones, while Customer Assistance Monitoring applies configurable wait thresholds to shoppers who appear to be waiting without staff nearby. Checkout Queue Monitoring focuses on queue length, persistence and service thresholds. Keeping those questions separate prevents one metric from being stretched into an answer for every retail problem.
Related FlowLinks use cases: Dwell Time Analytics · Customer Assistance Monitoring · Checkout Queue Monitoring
Longer dwell can be valuable — but context still matters
A 2021 study using six years of data from 43,326 customers examined how shopping duration relates to purchase probability and spending. The researchers found positive immediate and short-term relationships between shopping duration and buying behaviour, while longer-term effects were more nuanced and depended on shopping experience, promotion and mall size.
That does not mean retailers should simply try to make every visit longer. A shopper who quickly finds the right product, receives help and completes a purchase may have a shorter visit than someone who spends a long time confused and leaves without buying. The more useful question is whether time is being spent in places and situations that create value.
Location makes dwell time more useful
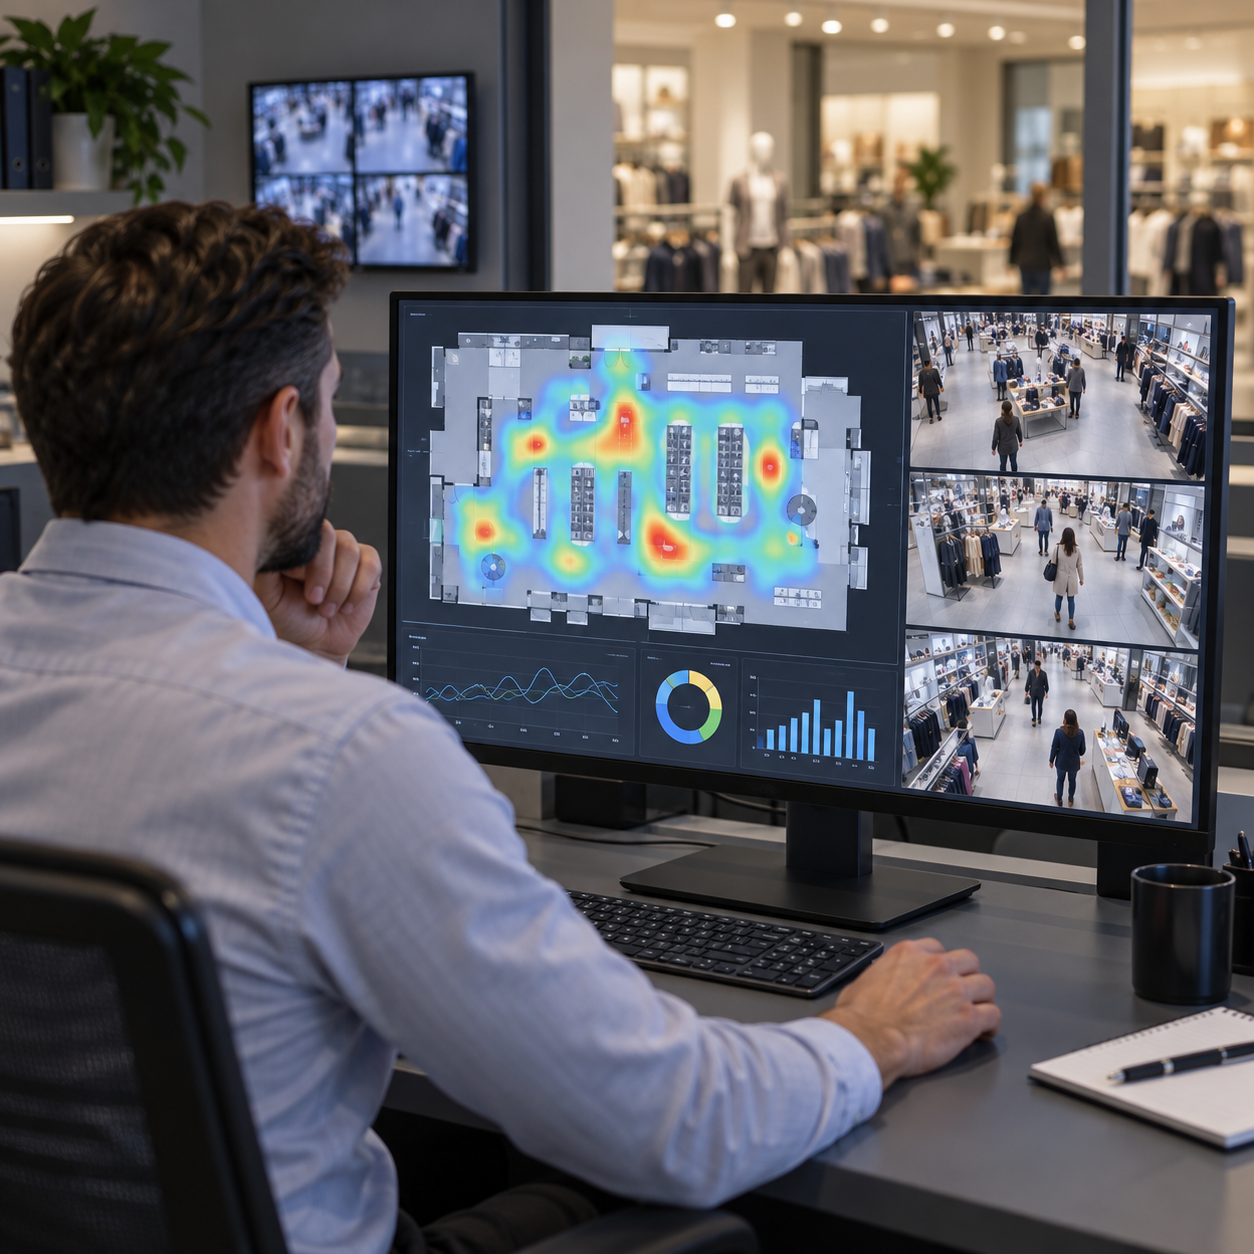
An average store visit of 18 minutes tells management something, but zone-level data gives the number operational meaning. One aisle may have high traffic but almost no dwell. Another may attract fewer shoppers but hold their attention for several minutes. A promotion may increase both footfall and dwell, while a different display may be passed quickly.
Research using more than 18 million shopper-location records has combined traffic and dwell metrics to identify stronger-performing store areas and model shopper paths. That reinforces the value of asking where people spend time rather than looking only at total visit duration.
There is no universal “good” dwell time
Different retail formats naturally produce different visit durations. A field study in Shenzhen that measured five supermarkets and 21 small shops found that customer dwell time differed across retail formats, and average supermarket dwell time increased with floor area in that dataset.
A convenience store, supermarket, jewellery shop and furniture showroom should therefore not be expected to share one ideal dwell-time benchmark. Even within a single store, what is normal for an entrance, fitting room, premium display or checkout-adjacent zone can differ significantly. Retailers get more value by establishing a baseline for each important zone, time period and store format.
Look for patterns, not individual shoppers
One shopper spending 12 minutes in an aisle is interesting. Hundreds of visits showing a consistent dwell pattern in that same aisle are operationally useful. The pattern can help management decide which zones deserve closer attention, which displays attract interest and where store journeys regularly slow down.
For example, repeated dwell changes may show that a new display is holding attention, that one aisle receives traffic but little engagement, or that behaviour differs sharply between morning and evening. FlowLinks’ Dwell Time Analytics is designed around this zone-level view, including dwell by zone, dead-zone identification, customer journeys, hotspots, promotion comparisons and time-of-day patterns.
How existing CCTV can become a dwell-time sensor
Many retailers already have cameras covering the sales floor. With suitable camera placement, video analytics can use those feeds to estimate movement through configured zones and calculate how long shoppers remain in them. This turns camera footage that was installed primarily for security into another source of operational data.
A simplified FlowLinks workflow is: existing CCTV → customer movement observed → store zones applied → time spent per zone calculated → dwell patterns and heatmaps generated → teams review trends. FlowLinks connects to suitable existing overhead and aisle camera feeds and uses zone-level analytics to support retail dwell analysis.
Camera suitability still matters. Field of view, occlusion, mounting angle, store geometry and the amount of a zone visible in the frame can all affect the usefulness of the data. A camera that clearly sees an entire aisle may support dwell analysis much better than one that captures only a doorway or a narrow section of shelving.
Dwell time becomes stronger when combined with other retail signals
Signal combination | What it may indicate | What to do next |
|---|---|---|
High footfall + high dwell | The zone attracts people and holds attention. | Investigate what is working and whether it connects to purchase or engagement outcomes. |
High footfall + low dwell | Many shoppers pass through but few stop. | Check whether it is simply a transit zone or whether merchandising is failing to create interest. |
Low footfall + high dwell | Few shoppers enter, but those who do spend meaningful time. | Useful for niche, premium or high-consideration categories. |
Long dwell + no nearby staff | The issue may be assistance rather than engagement. | Use a customer-assistance workflow with a configured wait threshold. |
Dwell time gives you time. Footfall gives you traffic. Queue analytics gives you waiting behaviour around defined queues. Customer assistance gives you unassisted wait events. Transactions can provide purchase outcomes when systems are integrated. Used together, those signals can create a richer operational picture than any one metric on its own.
The objective is not to maximize dwell time
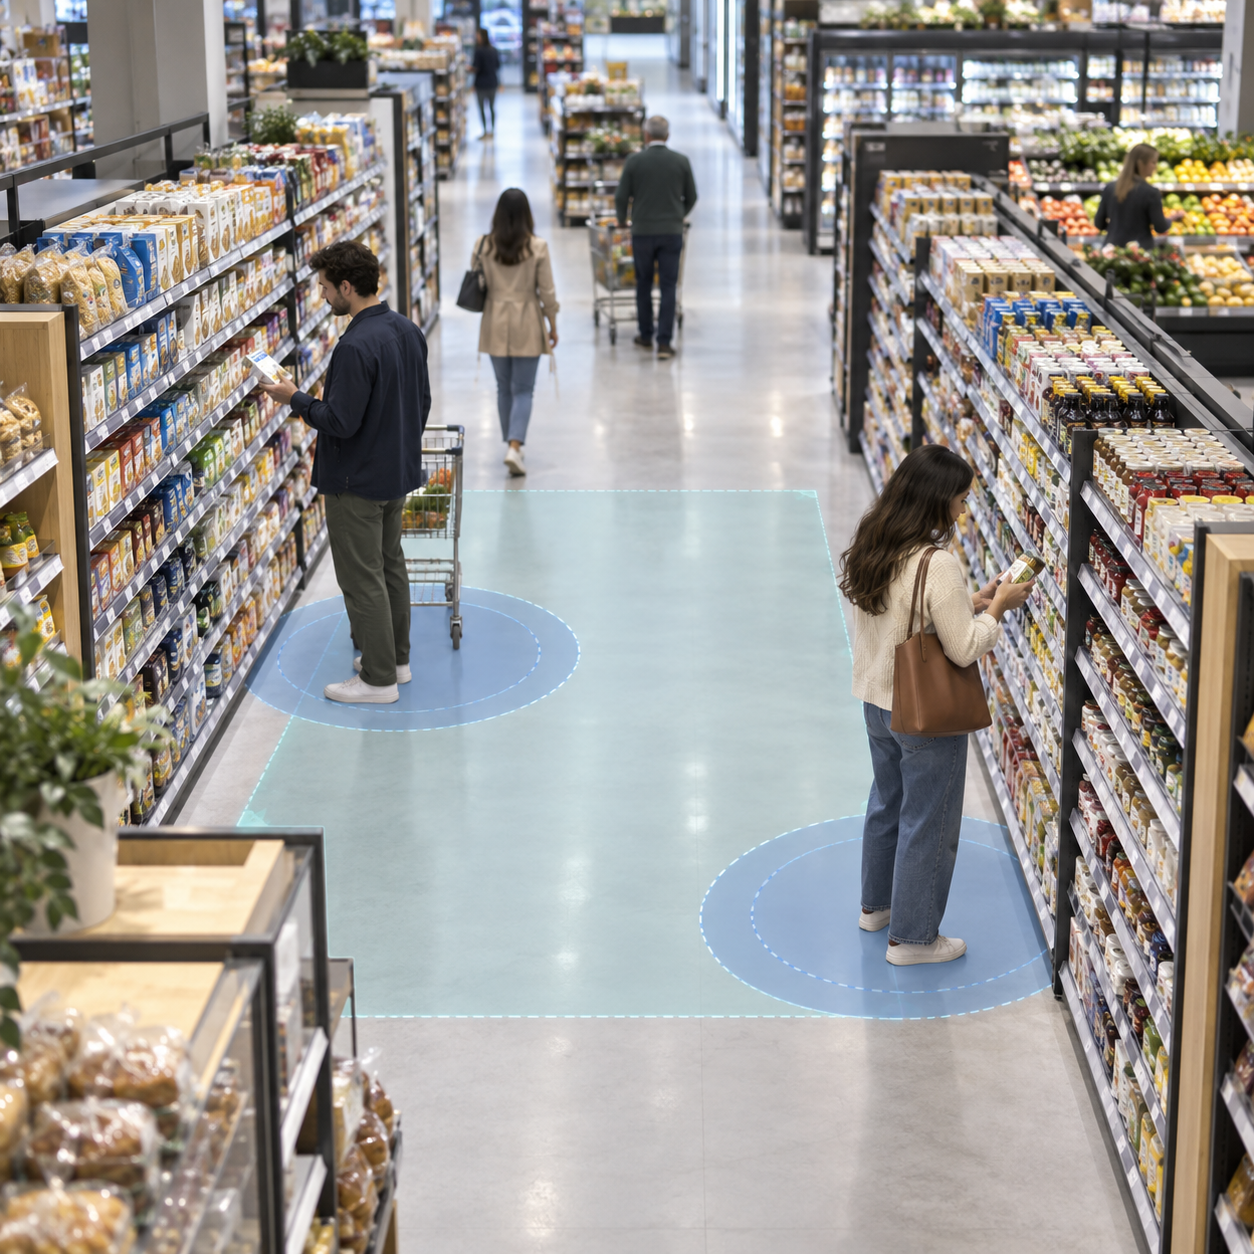
A common mistake is to treat dwell time like a scoreboard: more minutes equals a better store. Retail does not work that way. The goal is not to make every shopper stay longer; it is to understand where customers spend time, where they do not, how those patterns change and what those changes may tell the business.
That framing also protects the metric from being overinterpreted. Retail dwell time is a signal. It becomes more useful when the retailer connects it to a business question such as layout effectiveness, promotion performance, customer assistance or product-zone engagement.
What should a dwell-time pilot measure?
A useful pilot should start with a small number of clearly defined zones. Instead of immediately monitoring an entire store, choose areas where there is a real business question and establish a baseline before deciding what “good” or “bad” looks like.
Measure | What it helps answer |
|---|---|
Zone dwell time | How long are shoppers staying in this area? |
Footfall into the zone | How many people actually enter? |
Pass-through behaviour | Are shoppers stopping or simply moving through? |
Time-of-day pattern | Does behaviour change by hour, day or trading period? |
Promotion comparison | Did dwell or traffic change after a display or campaign changed? |
Heatmap pattern | Where do shoppers concentrate, linger or avoid? |
Assistance events | Is unusually long dwell sometimes linked to a lack of staff support? |
The purpose of the pilot is not to produce the most colourful heatmap. It is to determine whether the information helps the retailer make a better decision.
So, was 12 minutes good or bad?
You still need more context. If the shopper spent those 12 minutes comparing products in a high-consideration category, the time may represent strong engagement. If the shopper spent those 12 minutes waiting for help, the same number may indicate a service gap.
If many shoppers begin spending longer in the same zone after a merchandising change, the pattern may indicate that the display is changing behaviour. If the longer dwell comes from confusion or congestion, it may be telling the business something completely different.
That is why retail dwell time should be treated as a signal, not a verdict. The interesting question is not only “How long did the shopper stay?” It is “What was happening in that part of the store during that time?”
Pro Tip:
Start with one or two zones where you already have a business question. Compare dwell time with footfall, time of day and any relevant operational outcome before deciding what the number means.
Conclusion
A shopper spending 12 minutes in an aisle is not automatically good or bad. The value comes from understanding where that time was spent, how often the same pattern occurs and what other signals appear alongside it. With suitable existing CCTV, FlowLinks can help retailers turn zone-level movement into dwell patterns, heatmaps and operational trends. The technology provides the time-and-location signal; the retailer still decides what that signal means for layout, merchandising, service and store performance.
See What Your Existing Store Cameras Can Tell You
Start with one or two important store zones, define the business question and evaluate whether your existing camera coverage can provide useful dwell-time data.
Explore Retail Dwell Time Analytics with FlowLinksSources & Citations
- 1.Sorensen, H., Bogomolova, S., Anderson, K., et al. (2017). Fundamental patterns of in-store shopper behavior. Journal of Retailing and Consumer Services, 37, 182–194
- 2.Li, X., Dahana, W. D., Ye, Q., Peng, L., & Zhou, J. (2021). How does shopping duration evolve and influence buying behavior? The role of marketing and shopping environment. Journal of Retailing and Consumer Services, 62, 102607
- 3.A business application of RTLS technology in Intelligent Retail Environment: Defining the shopper's preferred path and its segmentation. Journal of Retailing and Consumer Services