Your Store Had a Big Sales Day. But Was It Actually Performing Well?


Customer footfall adds context to sales by showing how many people entered the store, when they arrived, and how traffic patterns changed across the day.
The store closes after what looks like a successful day. Sales are strong, the team hit its target, and the dashboard appears positive. But one number is missing: how many people actually walked through the door?
Imagine two stores generated exactly the same revenue. Store A received 800 visitors. Store B received 4,000. The sales result is identical, but the operational story may be completely different. That customer footfall number changes how the sales result should be interpreted.
Maybe Store A converted a larger share of its traffic. Maybe Store B attracted far more people but struggled with stock availability, queues, staffing or customer assistance. Revenue tells you the outcome; customer traffic helps show how much opportunity entered the store.
Research into physical retail performance makes a similar distinction. Store traffic, conversion and sales are related, but they are not the same measure. Research has also shown that staffing levels can affect how effectively incoming traffic translates into sales.
What does customer footfall actually measure?
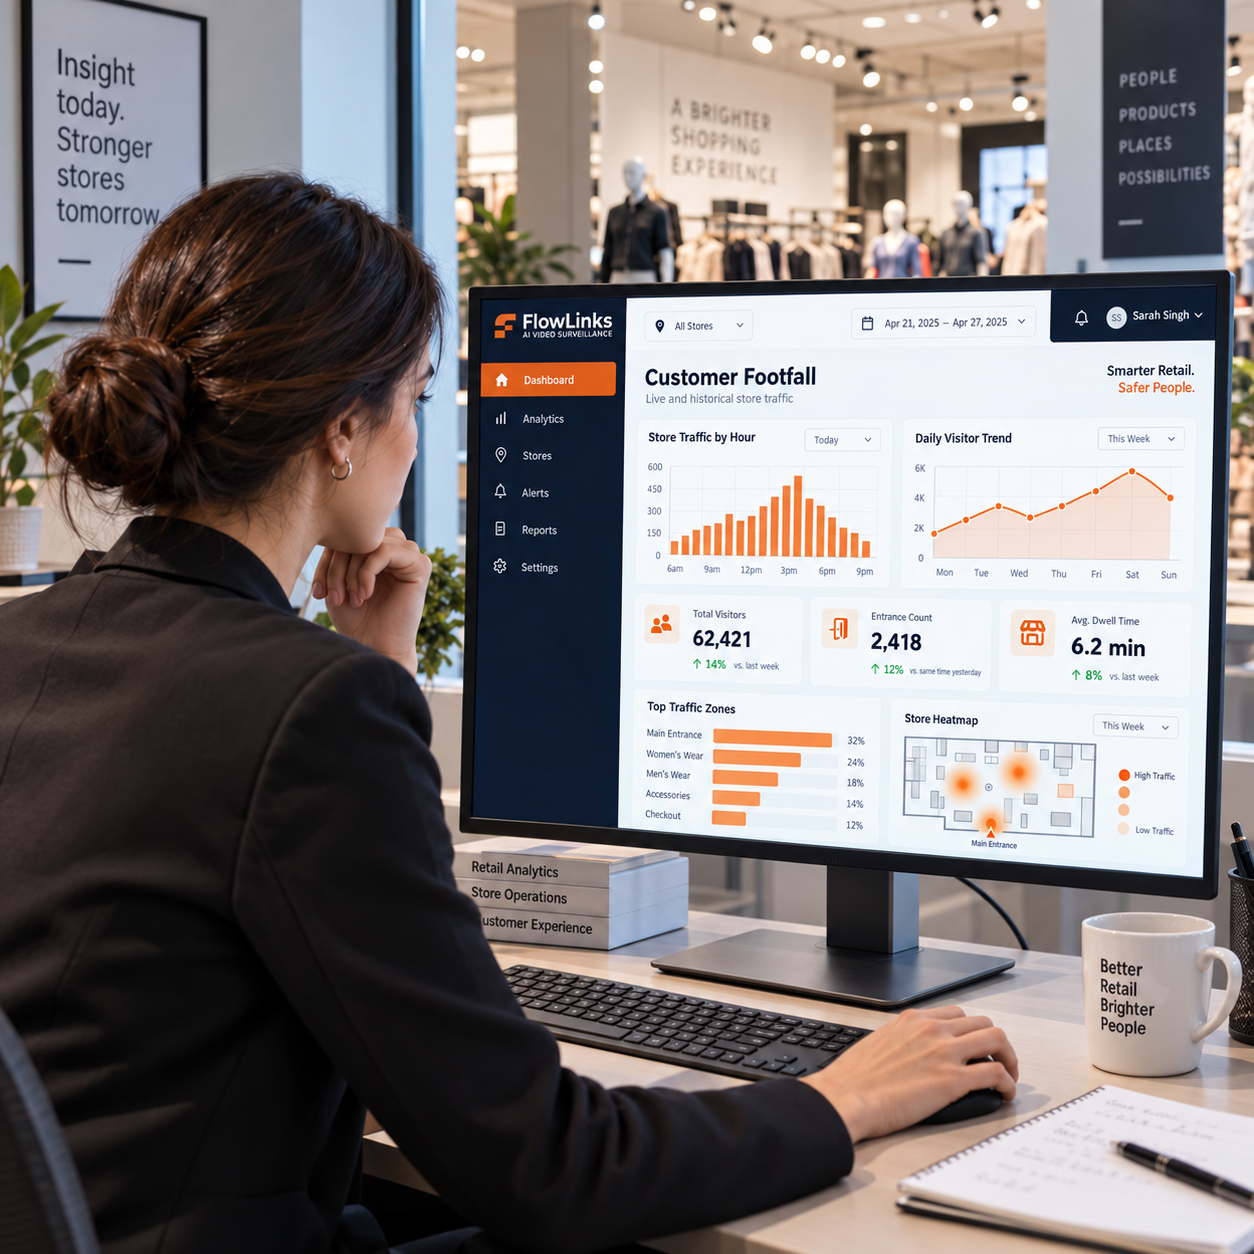
Customer footfall is the number of people entering a physical store or defined retail area during a particular period. Retailers can compare it by hour, day, week, store, entrance or campaign period.
Retail footfall is useful because it provides traffic context, but it should not be confused with unique customers, transactions or sales. A person entering the store has not necessarily made a purchase, and an entrance count cannot tell you why that person came in.
Research into retail performance commonly treats foot traffic, conversion rate and total sales as separate indicators rather than interchangeable numbers.
If sales rise 10% while customer footfall rises 40%, that tells a very different story from sales rising 10% while traffic remains flat. Neither situation should be judged from footfall alone, but without traffic data management cannot investigate the difference properly.
The same sales number can describe two very different stores
Return to the example of two stores generating the same revenue. Store A had 800 visitors. Store B had 4,000. It may be tempting to conclude that Store A performed better, but even that would be premature because we still do not know transaction count, average basket value, product mix, operating hours or whether the stores serve comparable customer profiles.
What we do know is that the two locations deserve different questions. For Store A, management might ask whether additional traffic could create more sales opportunities. For Store B, the question may be what happened to the much larger volume of customer traffic already entering the store.
Were queues building during busy periods? Was enough staff available? Were customers receiving assistance? Were certain parts of the store attracting attention while others remained underused? Store footfall gives management the traffic context behind the sales number. It does not provide every answer, but it points teams toward the questions worth investigating.
Daily traffic totals can hide what actually happened inside the store
Two stores may each receive 1,000 visitors during the day but experience completely different operating conditions. One could receive those visitors steadily across ten hours. The other might receive almost half its traffic during a short evening peak. The daily total is the same, but the staffing and service challenge is very different.
This is why hourly customer footfall can be more useful than a single daily number. Traffic patterns can reveal recurring peaks, quieter periods and differences between weekdays and weekends. When those patterns are compared with staffing, queue conditions, sales or customer-assistance data, retailers can investigate whether store resources were available when demand was highest.
Research examining physical retail stores has found that labor levels can affect the relationship between traffic, conversion and sales, reinforcing the value of looking at these measures together rather than in isolation.
Customer footfall is context, not a diagnosis
Customer traffic becomes more useful when it is compared with the rest of the store operation. If traffic stays stable while sales or conversion fall, management may investigate stock availability, queues, staff coverage, pricing, merchandising or customer assistance. If traffic itself falls, the investigation may shift toward marketing activity, seasonality, location conditions or nearby competition.
If a campaign generates a large increase in customer footfall but little movement in sales, the traffic data does not explain the reason. It simply narrows the problem: more opportunity entered the store, but something else in the journey needs investigation.
Customer footfall shows the size and timing of the opportunity entering the store. Other operational data helps explain what happened to that opportunity.
Counting people is harder than it looks
A store entrance seems like an easy place to measure traffic until it becomes busy. Families may enter together, two people can cross at almost the same time, employees leave for breaks and return, customers step outside briefly and re-enter, and some stores have several entrances. During peak periods one person may partly block another from the camera view.
People-counting systems also have to deal with practical computer-vision challenges such as occlusion, changing lighting and camera positioning.
Staff movement introduces another issue. If employees repeatedly cross the entrance and are counted as customers, visitor totals can become misleading. Retail people-counting systems therefore often need a way to handle or exclude employee movements depending on the business metric being measured.
The useful question is not whether software can draw a box around a person. It is whether the resulting traffic data is reliable enough to support the decisions the retailer wants to make.
How camera data can support customer footfall measurement
Many retailers already have cameras covering store entrances. Where those views are suitable, computer vision can turn entrance activity into structured traffic counts. The quality of that measurement depends on factors such as camera position, field of view, image quality, crowding and whether all relevant entrances are covered.
For retailers that want the product and deployment details, FlowLinks explains the counting workflow, dashboards and related capabilities on its Retail Footfall Analytics page.
What happens after people enter matters too
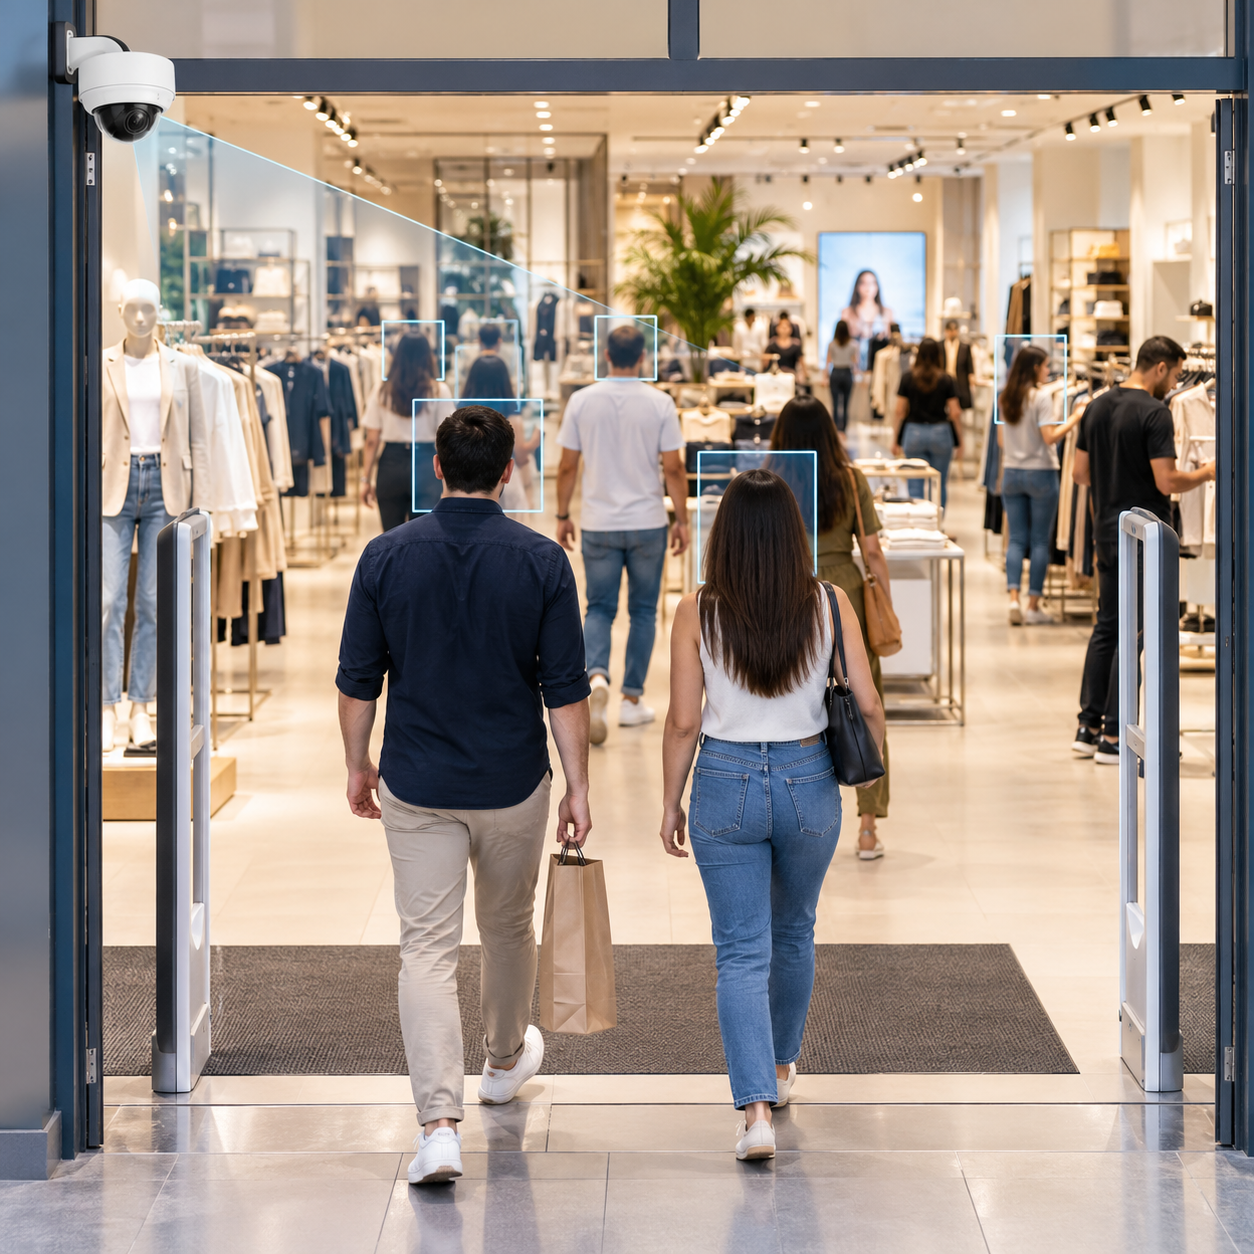
Entrance traffic is only the beginning of the customer journey. A spike in footfall becomes more useful when management can compare it with what happened next: where shoppers spent time, whether service conditions changed, or whether busy periods created friction elsewhere in the store.
For example, dwell-time analytics can help teams study how long shoppers remain in configured areas after entering the store. These are different measurements: footfall describes traffic entering the store, while dwell time describes time spent in a location.
For the broader set of store-operation use cases, see FlowLinks retail video analytics.
What customer footfall cannot tell you
Customer footfall should not be treated as an explanation for everything happening in the store. An entrance count cannot tell you why somebody came in, prove purchase intent, determine that a shopper left because an item was unavailable, or establish that a promotion caused a sales increase simply because traffic rose during the same period.
Without transaction data, visitor counts also cannot provide a true purchase conversion rate. Camera limitations matter too: heavy occlusion, unsuitable viewing angles, missing entrance coverage or poor image quality can affect counting performance. Staff/customer separation and re-entry behaviour also need to be handled according to the business metric the retailer actually wants.
Footfall data is valuable because it measures traffic. Management still needs the wider operational context to understand the reason behind the numbers.
A better question than “How much did we sell?”
Sales will always matter, but sales alone describe what happened at the till. Customer footfall adds another part of the story: how much opportunity entered the store, when that opportunity arrived, and how traffic differed between locations or periods.
That allows retailers to ask better questions. Did the busiest traffic periods coincide with longer queues? Did a promotion bring more visitors without changing conversion? Did two stores generate similar sales despite very different traffic levels? Was staffing aligned with the hours when customer footfall was highest?
The conversation can then move from “We had a good sales day.” to “We understand more about what happened in the store that day.” That is a much stronger starting point for improving the next one.
Want to measure store traffic from your existing cameras?
If your goal is to turn suitable entrance-camera views into operational traffic data, explore FlowLinks Retail Footfall Analytics for the system capabilities, workflow and deployment details.
Pro Tip:
Don’t judge footfall in isolation. Compare customer traffic with sales, staffing and peak-hour conditions to understand what was actually happening in the store.
Conclusion
A strong sales day can look impressive, but sales alone do not show how much opportunity entered the store or when that traffic arrived. Customer footfall adds that missing context by showing how many people came in and how traffic changed across the day. The real value comes from comparing that traffic with sales, staffing, queues and other store conditions. Footfall does not explain everything on its own, but it helps retailers ask better questions about store performance. With the right camera coverage and reliable counting, customer footfall can become a practical input for smarter retail decisions rather than just another number on a dashboard.
Turn Store Traffic Into Useful Retail Insights
See how FlowLinks can turn compatible retail cameras into footfall analytics that help teams understand store traffic by time and location.
Explore Retail Footfall AnalyticsSources & Citations
- 1.Perdikaki, Kesavan & Swaminathan, “Effect of Traffic on Sales and Conversion Rates of Retail Stores,” Manufacturing & Service Operations Management.
- 2.Ramírez et al., “Forecasting Key Retail Performance Indicators Using Interpretable Regression,” Sensors.
- 3.FLIR/Brickstream retail analytics material on removing staff from people-counting metrics.